

How to calculate a CAD tolerance stack-up
A nominal assembly can look perfect and still close its gap, miss its alignment, or jam after manufacturing variation is added. A useful tolerance stack starts with the functional requirement, follows the real locating scheme, and treats statistical results as evidence rather than permission to ignore worst cases.
Quick answer
Calculate a CAD tolerance stack-up by defining the functional output, drawing a signed dimension loop through the features that control it, and combining each contributor first by worst case. Use RSS or Monte Carlo analysis only when process distributions, independence, and assembly behaviour are supported by data, then verify the result against physical inspection and the released datum scheme.
The assembly on the second monitor had a clean 1.2 mm gap. The supplier's inspection sheet said otherwise. By Friday afternoon, the gap had become three dimensions, two datum arguments, and a cold mug of coffee parked beside a calculator that was doing a better job than the CAD model.
A nominal assembly only shows where perfect parts meet. To calculate a useful tolerance stack-up, define the functional output, build a signed dimension loop through the features that actually locate the parts, and combine the allowed variation. Start with worst case. Use statistical tolerance analysis only when the process data and assumptions deserve it.
This is a source-based workflow with an illustrative calculation, not a production tolerance study. I have not measured these example parts, sampled a manufacturing process, or qualified a commercial tolerance-analysis package.
Nominal CAD is not a fit prediction#
CAD geometry is exact because exact geometry is convenient. A 20 mm boss is 20 mm. A 12 mm pocket is 12 mm. A 1.2 mm gap stays 1.2 mm until somebody adds the tolerances, coatings, locating error, temperature, and assembly sequence that the physical product has been saving for later.
An interference check does not fix this. As the assembly interference guide explains, nominal solids can avoid overlap while the manufactured parts still lose their required clearance. The model answers whether the perfect geometry clashes at one position. A stack-up asks how far the functional result can move when permitted variation arrives.
ASME Y14.5-2018, reaffirmed in 2024, provides the US system for dimensioning and tolerancing. The standard tells teams how to communicate size and geometric requirements. It does not choose the functional requirement, datum scheme, or acceptable failure risk for a product. Those decisions still belong to the design and manufacturing team.

The SOLIDWORKS partner page shows 3DCS updating an analysis from CAD geometry. This is vendor interface imagery, not an independent accuracy result. Source: 3DCS Variation Analyst for SOLIDWORKS.
Start with one measurable requirement#
Do not begin by collecting every drawing tolerance into a spreadsheet. Begin with the thing that must still work when the parts are awkward.
That output might be minimum seal compression, maximum shaft endplay, connector alignment, bearing preload, a door's gap and flush, or the clearance between a cover and a moving link. Give it a nominal value, limits, and a measurement direction. If the requirement is vague, the calculation will be precise theatre.
Then identify how the assembly establishes that result:
- Choose the base part and the functional measurement direction.
- Follow the contact and locating path from the base to the measured feature.
- Record each contributing dimension with a positive or negative sign.
- Include geometric controls when orientation or position changes the output.
- Exclude dimensions that do not sit on the functional loop, even when they are nearby on the drawing.
The sign matters. A larger pocket might increase a gap while a taller spacer decreases it. Adding every printed dimension as a positive number is how a spreadsheet becomes a confident little liar.
The locating path matters even more. Metrologic DCS's 6 October 2026 tolerance-analysis guidance warns that a simple stack can miss reference surfaces, constraints, assembly sequence, locating strategy, and flexible-part behaviour. That is a supplier's explanation of its own software domain, so treat it as technical guidance and a statement of product capability, not independent proof.
A worked one-dimensional stack#
Consider a cover that needs at least 0.80 mm clearance above an internal bracket. The nominal gap is 1.20 mm. Three independent-looking dimensions control the result:
| Contributor | Nominal effect on gap | Drawing tolerance | Sign |
|---|---|---|---|
| Housing pocket depth | 12.00 mm | ±0.20 mm | + |
| Spacer thickness | 5.00 mm | ±0.10 mm | - |
| Cover boss height | 5.80 mm | ±0.15 mm | - |
The nominal loop is:
gap = pocket depth - spacer thickness - boss height
gap = 12.00 - 5.00 - 5.80 = 1.20 mm
For a worst-case stack, add the absolute tolerance contributions:
worst-case variation = 0.20 + 0.10 + 0.15 = ±0.45 mm
gap range = 1.20 ± 0.45 = 0.75 to 1.65 mm
The stack fails the 0.80 mm minimum by 0.05 mm. The CAD model still looks immaculate. That is why nominal clearance is not release evidence.
There are several honest responses. Increase the nominal gap. Tighten a contributor the process can economically control. Change the locating scheme. Remove an unnecessary interface. Or redesign the function so one small variation does not decide whether the assembly works. Tightening all three dimensions is usually the most expensive answer and often the laziest.
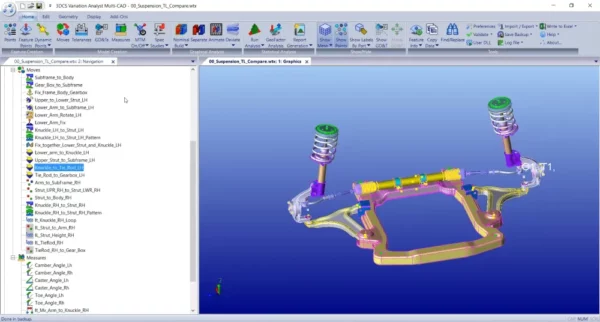
Metrologic DCS uses a suspension assembly to illustrate mechanical variation analysis. The image shows analysis context, not a verified result for the example above. Source: 3DCS Variation Analyst.
Worst case and RSS answer different questions#
Worst case assumes every contributor reaches its limit in the harmful direction at once. It is conservative, easy to audit, and useful when any permitted combination must assemble. It can also drive cost into parts when the all-at-limits combination is extremely unlikely and the requirement allows a quantified statistical risk.
The root-sum-of-squares method combines standard deviations rather than simply adding limits. NIST Technical Note 1297 describes RSS as the usual method for combining standard uncertainty components, with covariances included when appropriate. That last clause is not decoration.
If, and only if, the three drawing bands in the example represented comparable independent three-sigma process limits, their estimated standard deviations would be about 0.067, 0.033, and 0.050 mm. The combined standard deviation would be:
combined sigma = sqrt(0.067² + 0.033² + 0.050²)
combined sigma ≈ 0.090 mm
three-sigma variation ≈ ±0.269 mm
That produces an estimated three-sigma gap of roughly 0.93 to 1.47 mm. It passes the 0.80 mm requirement on those assumptions.
It does not overturn the worst-case result. A drawing tolerance is a limit, not automatically three standard deviations. Processes can be off-centre, non-normal, mixed across machines, altered by tool wear, or correlated because two features share a setup. NIST also distinguishes standard uncertainty from error and says covariance belongs in the combination when inputs are related. Replacing 0.20 + 0.10 + 0.15 with a square-root button does not create process knowledge.
Monte Carlo analysis extends the statistical idea by sampling input distributions repeatedly and calculating the output distribution. It can handle nonlinear geometry and mixed distributions better than a simple RSS loop. Its answer is still conditional on the distributions, correlations, assembly logic, and number of trials supplied to it.
The official SOLIDWORKS partner resource demonstrates reading embedded PMI into a variation study. It shows product workflow, not proof that imported tolerances or assumptions are correct. Source: 3DCS Variation Analyst for SOLIDWORKS.
Where a one-dimensional loop breaks#
A 1D stack works when the contributors act along one clear direction and the assembly contacts are stable. Real assemblies often decline that invitation.
A hole pattern can shift and rotate a bracket. A pin may float inside a clearance hole until another fastener seats. A tapered surface can convert axial variation into radial movement. A thin panel can deform under clamp load. A rubber seal can compress nonlinearly. Temperature can move two materials by different amounts. Surface finish, burrs, coatings, and adhesive thickness can add variation that the nominal solid does not contain.
The fresh Metrologic DCS guidance calls out three particular traps: oversimplifying the assembly, choosing the wrong positioning strategy, and treating flexible parts as rigid. Those are useful checks even if no 3D tolerance package is available.
Ask these questions before trusting the loop:
- Do the selected datums match the surfaces that locate the physical assembly?
- Can components shift inside clearance features before fasteners are tightened?
- Does assembly order change the final position?
- Can angular error create a larger offset at the measured point?
- Do gravity, clamps, seals, or compliant parts deform the geometry?
- Are thermal growth, coating, wear, or process drift significant to the requirement?
If any answer is yes, the spreadsheet may still be a useful first screen. It is no longer the whole model.
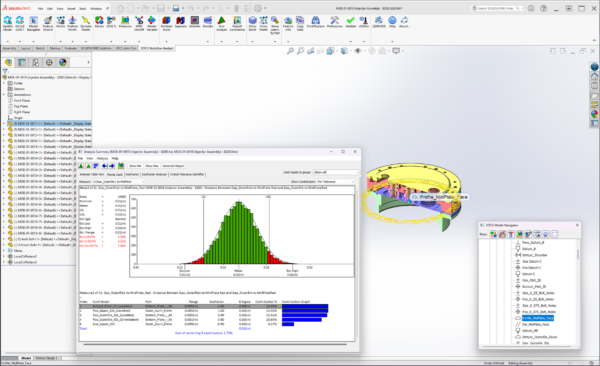
Metrologic DCS shows a CAD assembly used for a dimensional study. A 3D model can retain locating and geometric context that a linear chain omits, but the analyst still owns the inputs. Source: 3DCS Variation Analyst.
What a 3D tolerance tool adds#
Commercial tolerance-analysis tools connect the study to CAD geometry, PMI, assembly moves, and a statistical engine. The SOLIDWORKS partner listing for 3DCS says the product provides Monte Carlo, high-low-mean sensitivity, geofactor analysis, variation contributors, gap-and-flush measurements, and report generation. Those are vendor-described features.
The useful output is not merely a coloured probability plot. Sensitivity and contribution results can show which dimensions actually drive the functional result. That lets a team spend tolerance cost on the contributor that matters instead of shaving every title-block value because the assembly meeting became tense.
CAD integration also reduces transcription, but it does not remove review. Check which model revision the study references, whether suppressed configurations are included, how PMI was interpreted, which contacts and moves locate each component, and whether the reported measurement matches the engineering requirement.
The official partner video shows 3D tolerance analysis inside SOLIDWORKS. It is a vendor demonstration of integration and analysis output, not an independent benchmark. Source: 3DCS Variation Analyst for SOLIDWORKS.
A release workflow that survives inspection#
Use the smallest analysis that faithfully represents the risk, then keep its evidence with the released design.
- Write the functional measurement and its limits in plain language.
- Identify the physical contacts, datums, and assembly sequence that establish it.
- Build a signed 1D loop and run worst case first.
- Review geometric tolerances, angular effects, and clearance shifts that the linear loop omits.
- Add statistical analysis only with documented distributions, centring, capability, and correlation assumptions.
- Compare sensitivity results with the manufacturing plan. A supposedly dominant dimension should have a plausible process and inspection route.
- Measure representative assemblies and compare production data with the prediction. Update the model when the factory disagrees.
- Release the drawing, PMI, analysis revision, assumptions, and acceptance result together.
That last step matters. A tolerance report detached from the drawing revision is another mystery spreadsheet waiting to be rediscovered after a supplier change.
The drawing workflow and CAD version-control guide cover the surrounding handoff. The stack belongs beside that evidence, not in somebody's downloads folder with final_v7 in the name.
The result is only as real as the locating scheme#
Tolerance analysis is not a ritual performed after the model is finished. It is a way to test whether the design still functions when the parts become physical and stop obeying nominal dimensions.
Start with worst case because it exposes the contract the drawing makes. Use statistics when data supports a probability model, not because RSS gives a friendlier number. Move to 3D analysis when contacts, datums, rotation, sequence, or flexibility control the result. Then compare the prediction with actual inspection.
The clean CAD gap is the beginning of the question. The released stack, the process data, and the measured assembly are the answer.
Related articles
Text-to-CAD
Does text-to-CAD understand tolerances?
No. Text-to-CAD tools generate nominal geometry without tolerances, GD&T callouts, or fit specifications. The generated models have no tolerance information, no datum references, and no understanding of manufacturing process capabilities. Tolerance specification remains entirely manual work that requires engineering knowledge AI tools don't have.
CAD Workflows
CAD assembly interference checks: what a clean result misses
Run interference detection on the exact released assembly to find overlapping nominal solids, then check minimum clearance and collision through every critical motion. A clean static result does not prove tolerance-safe fit, room for movement, flexible-part behaviour, or manufacturing readiness.
Text-to-CAD
Can text-to-CAD generate engineering drawings?
Text-to-CAD can contribute to an engineering drawing when it works inside a CAD system with drawing automation, but it does not turn a prompt into a trustworthy released drawing by itself. As of October 2026, SOLIDWORKS documents AI-assisted drawing generation and Onshape can replicate existing annotations; the engineer still owns datums, tolerances, manufacturing notes, and approval.
Newsletter
Get new CAD articles in your inbox
Text-to-CAD guides, new tools, CAD comparisons, and practical tutorials.